Harmonic Chart Patterns
Using harmonic chart patterns for day trading can be a lucrative endeavor as it has been calculated that they are highly accurate between 70 to 93% correct, along with the ability for the trader place a strategic stop loss just outside of the developing pattern.
For many years these patterns have only been known to a limited
number of well researched and experienced traders. For example one of
the most famous patterns is called the Gartley Pattern which
was first outlined by HM Gartley in its basic structure in his book,
Profits in the Stock Market,(Lambert-Gann Publishing, 1935) page 222.
Brainyforex is testing the accuracy of the Gartley price pattern here.
It has been noted that contrary to what many have claimed, Mr.
Gartley was NOT responsible for assigning Fibonacci ratios to this price
structure. People whom have read his book, Profits in the Stock Market
say that it does not mention anything about Fibonacci ratios throughout
the whole book.
Bearing that in mind; Investopedia explains Gartley Pattern;
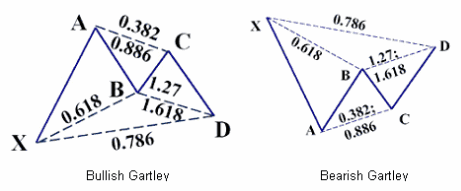
The Gartley example below shows an uptrend XA with a price reversal at A. Using Fibonacci ratios, the retracement AB should be 61.8% of the price range A minus X, as shown by line XB. At B, the price reverses again. Ideally, retracement BC should be between 61.8% and 78.6% of the AB price range, not the length of the lines, and is shown along the line AC. At C, the price again reverses with retracement CD between 127% and 161.8% of the range BC and is shown along the line BD. Price D is the point to buy/sell (bullish/bearish Gartley pattern) as the price is about to increase/decrease.

Check out our observations for the trading statistics for the Gartley price pattern here.
Other significant harmonic trading patterns include;
The Butterfly here.
The Crab here.
The Bat here.
How Do You Feel About This Topic?
What are your thoughts about this? Share it!


