Euro Currency Analyzed According to WD Gann
16 February 2011
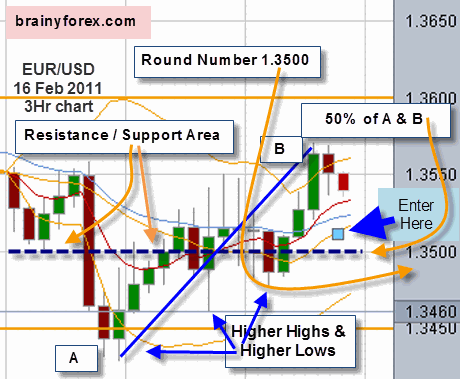
On today's currency chart of Euro or EUR/USD 16 February 2011 we see four indications that price "may" move higher from here.
Price is currently on 1.3522 moving down towards our preferred buying area of just above 1.3500.
From
the 3 hour price chart shown below notice the following four
indications that WD Gann mentioned that show price should move upwards
after touching the 1.3500 price level;
1) Price is retracing toward a major psychological round level of 1.3500.
2)
Price will reach the 50% retracement level of the current uptrend once
it reaches the 1.3500 level. Notice half way point between point A &
B.
3) 1.3500 is a resistance / support level as shown on the chart.
4) Notice price currently making higher highs along with higher lows.

The blue box on the chart shows where we would look at buying the
EUR/USD currency. The pending order is 10 pips above 1.3500 at 1.3510.
Remember
that there are no certainties even with Gann analysis techniques, only
probabilities. Our goal in buying and selling the Euro currency at the
most opportune times is to have the probabilities in being correct
stacked in our favor.
We also know from inter-market behavior that the US Stock Market is bullish and the US Dollar is bearish, which in turn means the pressure is for the Eur/Usd currency pair to move higher from this point.
Next Day - As It Happened

Next day 17 February 2011
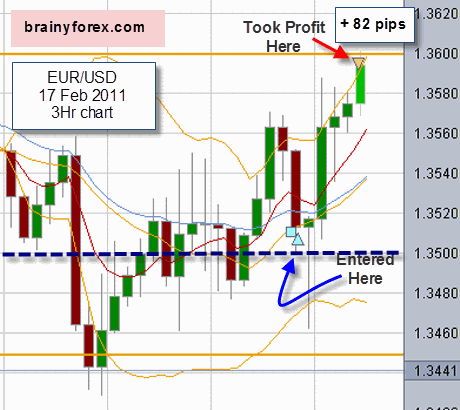
Next day woke up to find our short term investment had worked out and closed the euro position for + 82 pips profit at 1.3592.
Notice that price did not stop on the 1.3500 level. Instead it proceeded down further to 1.3462 before moving back upwards.
If
we had the time to watch the price bars we could have waited for the
prior high of the previous bar to be exceeded before entering the
position. Or we could have programmed our strategy into a automated
trading system to do this for us. As it was we opted to enter the
position without such luxuries and still worked out.
The reason for closing the position at 1.3600 was because it is psychological round number.
1.3600 is also a former resistance area.
It is also a natural square level. Refer the orange lines on chart.
Also, at the top of a bollinger band.
Traders
whom like trading within the bollinger bands would have had a perfect
trade as notice the lower bollinger band would have produced a perfect
entry signal.
Also, remember price may continue to move upward
from this point as each LOW of the former price bar is higher than the
last price bar. Some traders may like to wait for the prior low of the
prior price bar to be broken before closing the position. It all depends
on your trading strategy time frame.
Other traders may now
like to close the position at this point and then wait for another
pull-back before re-entering with another position.
Nobody in the world of finance and investing forces you to keep your money invested during a down cycle!
Return to Euro analysis here.
Return home from Euro Currency Analysis


New! Comments
Have your say about what you just read! Leave me a comment in the box below.