Gann Analysis of Euro Vs Usd
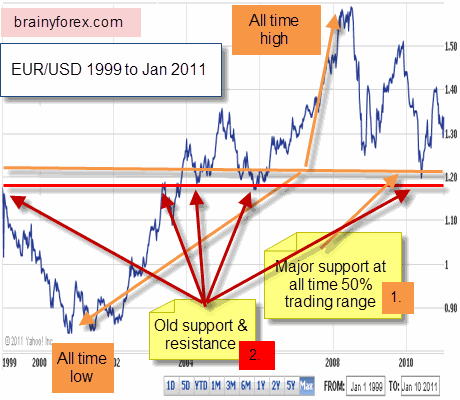
As shown on the Euro vs Usd chart below, one technique which WD Gann explained was finding the mid point between the highest and lowest that a security had traded.
Point 1. Shown on the chart is marked with a tan line which
represents a major support level that may become active very soon. It is
just above the 1.2000 level.
Point 2. Shown by the red line
and red arrows represent old resistance / old support. Gann explains
that once resistance is broken, usually it becomes support. The red
arrows show clearly this to be the case on many instances in the past
twelve years since the Euro has been trading. This level is near the
1.2000 mark.
If price trades down toward 1.2000 we can expect to see a high level of probability that it will react at this level. The chances are high that if it hits this level it will move back up again from here.

Eur/Usd chart January 1999 to January 2011
Remember that these are only a couple of chart reading techniques suggested by WD Gann.
In his own words, "It is possible to get as many as nine confirmations of reasons why a market should be at a bottom or top at a certain time. And the greater number of confirmations, the surer the chances of (reaping rewards)."
More techniques expounded by WD Gann;
Price moves up or down by patterns
See how higher highs and higher lows show uptrending market here.
Market moves in two & three sections at a time
Read price action by watching out for two and three thrust moves. Go here.
Price may react at round numbers
Take a look at how price has reacted to these round numbers over the last few months here.
Example : Euro Analyzed on 16 February 2011.
Take a look at this example here.
Return home from eur vs usd analysis


New! Comments
Have your say about what you just read! Leave me a comment in the box below.