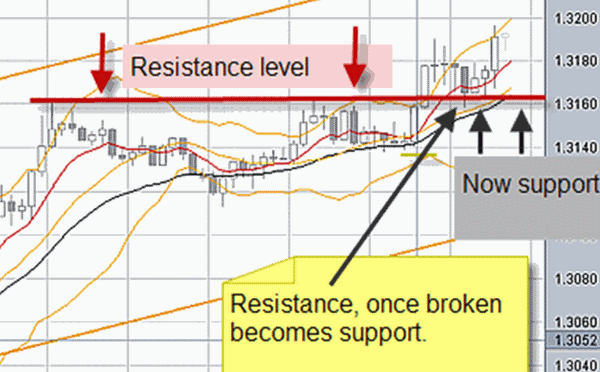
"Old resistance becomes support" and
"Old support becomes resistance"
WD Gann identified that once price broke through resistance, in many cases this old resistance level would act as support for price. The same principle holds true for when price falls below an established support level, it would mean that this area now has a high probability of acting as resistance and price will have some difficulty moving back through that level.
If your charting software allows you to 'crunch up the chart', this is the best way to identify support and resistance levels.
Once
you have condensed the chart, you should be able to easily see where
'most persons' are buying and selling. If you have not yet tried this
technique, give it a try and see how it can improve your performance.
Just remember that the probabilities for long-time support and resistance levels to be breached (breakouts) are 'far less' than prices being rejected on these well established levels. WD Gann said that a speculator should watch how price reacts at these levels. He likened it to water trying to exceed the barriers on a dam wall.


New! Comments
Have your say about what you just read! Leave me a comment in the box below.