Gann a big believer in market cycles
In WD Gann's writings on market behavior he said that markets continue to repeat themselves over and over again.
He said that this 'cycle pattern' was in line with the laws of nature whereby most things have a cycle or pattern.
These cycles occur on large time frame such as the ninety or sixty year cycle down to yearly or hourly time frames.
He mentions for example to be observant to the last digit of the
year. For example the year ending with "9" would indicate a bullish year
whereby stocks would move upwards during those time periods. So looking
far into the future 2019 has a high probability of being a 'bullish
year'.
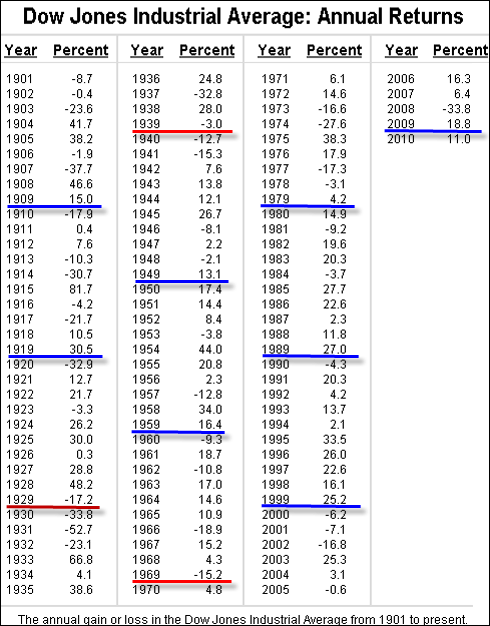
Back testing WD Gann's theory on market cycles is very easy as we
can see that the past ten year cycles have played out as follows since
1909;
2009 bullish
1999 bullish
1989 bullish
1979 bullish
1969 bearish
1959 bullish
1949 bullish
1939 bearish
1929 bearish
1919 bullish
1909 bullish
This shows a accuracy of of 73%. (8 bullish years out of 11).
[Check out the table below]
For readers interested in exploring this method of forecasting to
improve their market analysis technique a software program has been
developed which enables users to quickly filter this type of
information. For further information visit
www.trademiner.com.
Or find out a little more about this software here at brainyforex by clicking
here.
Read more about WD Gann's background here.

Data for this chart was kindly provided by Forecastchart.com


