Swing Trading Strategy
Makes More Money
as Follows Price Fluctuations
 |
"Swing Trading Strategy Most Profitable..."
WD Gann 'New Stock Trend Detector'1936 page 132. "There is always more money to be made trading for fluctuations "You can go over past records for any period and |
Further, WD Gann goes on to explain that the best kind of chart to consider for daily moves is a chart which records all reverse moves or reactions that run 2 or 3 days; then after there has been a series of advances or up swings, the first time prices break below the last SWING BOTTOM on the 2 or 3 day chart, it is indication the trend is changing.
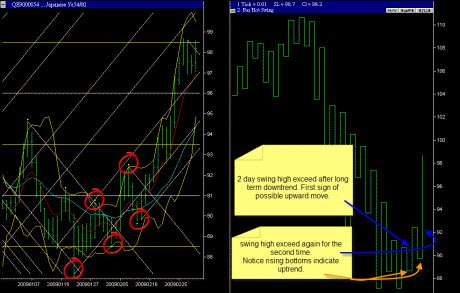
When a market is declining and has run for a considerable length of time, making lower tops and lower bottoms on the 2 or 3 day chart, the first time it crosses the last high on this SWING CHART, it is an indication that the trend is changing and that a further rally will take place.
Lets look at an example USD/JPY
Daily Chart
2 Day Swing
click on chart for larger view - opens in new window
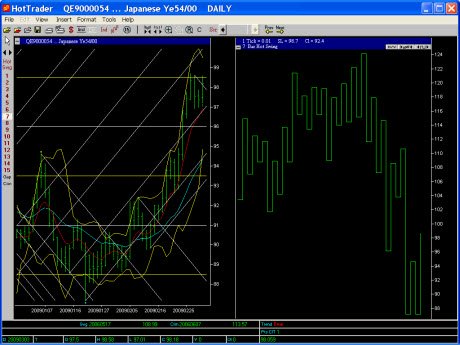
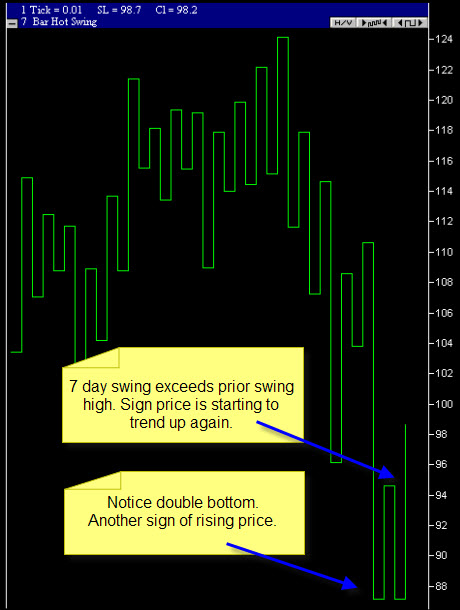
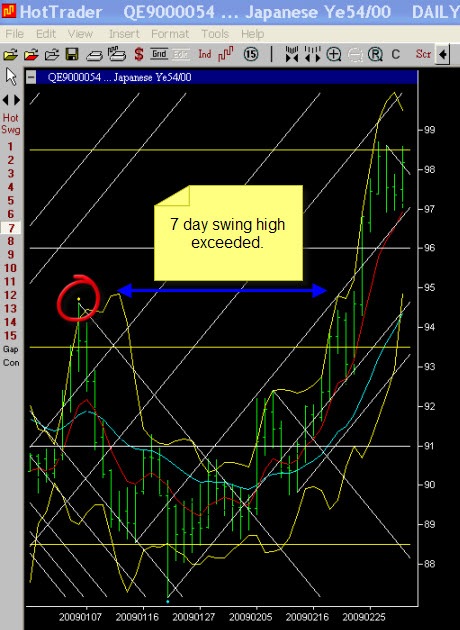
7 Day Swing Chart
WD Gann also draws our attention to the fact that a swing chart which records reverse moves of 7 calendar days or more, is of greater importance for a change in trend than the 2 or 3 day chart. On page 317 'How to Make Profits in Commodities'1951 "I consider the 7-DAY SWING CHART one of the most valuable trend indicators. You can start counting the time period from any extreme high or extreme low and when the advance or decline runs for 7 calendar days or more, you would move the Swing Chart up or
down".
Weekly Chart
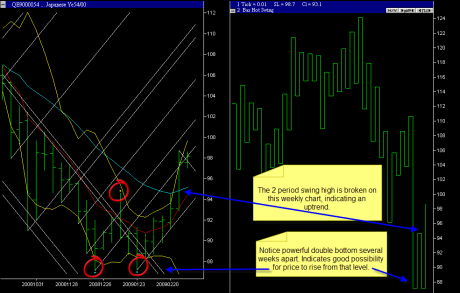
Lets now take a look at the weekly chart, using the 2 period gann swing. On this chart we are still showing an uptrend. Of importance too is the double price formation.
click on chart for larger view - opens in new window
Monthly Chart
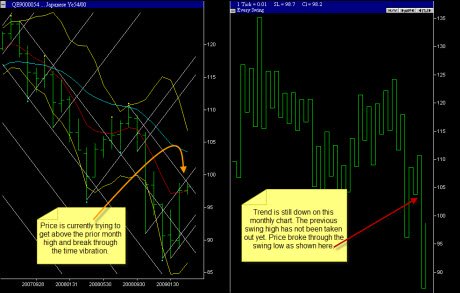
For our swing trading strategy we check the longer term monthly chart to see if we are in a uptrend or downtrend. As shown on the one period monthly swing we see price still in a long term downtrend. This means we have to be careful with any long positions.
click on chart for larger view - opens in new window
Summary of Swing Trading Strategy
In summary, WD Gann advocated trading with the trend. The swing chart method that he developed provides visual clarity to the direction of the trend. He mentions that the swing charts take out the noise in the markets.
WD Gann advocated using the 7 day swing chart (or greater level)as one of the primary means of telling the overall direction of the market. Followed by using the two day swing chart. (He also did use the three day swing chart earlier in his trading but then decided that the two day was better). click here for evidence of this change.
WD Gann's original course is dated June 1933. The alteration to use the 2 day chart rules instead of the 3 day was made in early 1955. The alteration reads "Use 2 day charts and rules better than 3 day. Signed W.D Gann"
He also used the 'one day' swing on a daily chart as a seperate mechanical swing trading strategy. He would add to his positions in a pyramid fashion as price exceeded the daily swing highs, while moving his stop loss up under the last swing low. His idea was to keep his position active as long as it was moving in his favor and exit the undesirable positions as soon as they showed a sign of weakness.
Who was WD Gann? and what did he discover? click here to find out.
How Do You Feel About This Topic?
What are your thoughts about this? Share it!
Return Home from Swing Trading Strategy



New! Comments
Have your say about what you just read! Leave me a comment in the box below.