Current WD Gann's Swing Trading Forecasts Updated Weekly
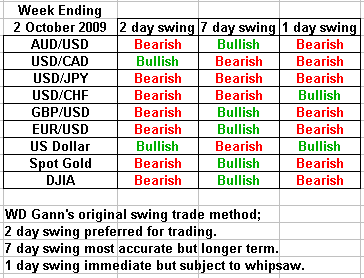
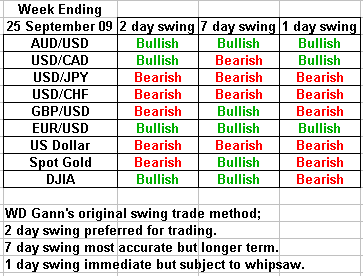
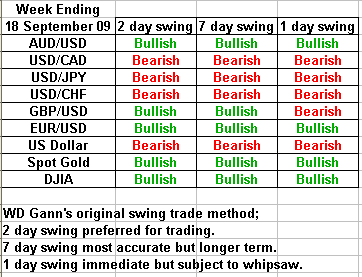
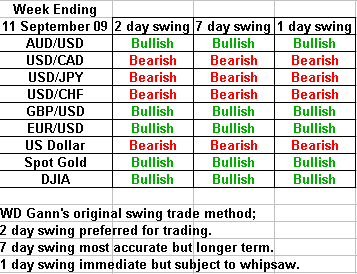
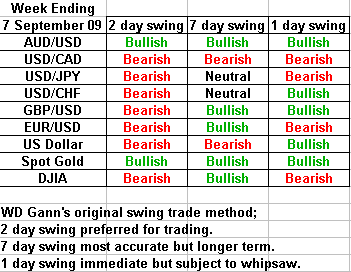
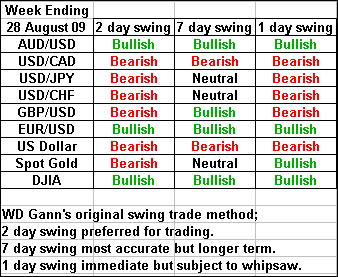
Swing trading forecast's presented here are based on WD Gann's original swing trade methods.
To learn more about WD Gann - go here.
To learn more about how the swing trade rules work - go here.
In a nutshell, the idea is to follow the swing rules as a mechanical method of trading.
To reduce your risk, it is possible to wait for a 50% retracement on an active swing move before entering a position.
In WD Gann's writings he explains that in one form of his trading methods he would initiate a position only after a 1 day swing move retraces back to the 50% level. Entering trades this way reduces risk, which most successful traders like to do. This is what is known as a "low risk trading strategy".
Market Commentary
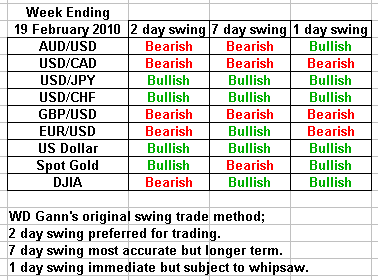
Week beginning 22 February 2010
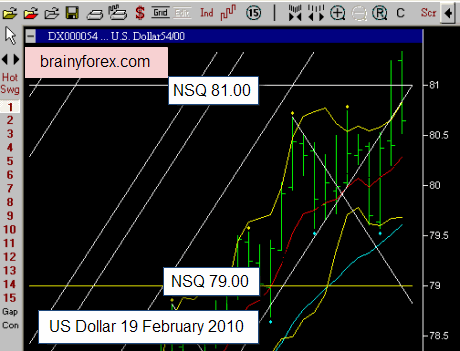
US Dollar daily chart 19 February 2010.
US Dollar closed on 80.64 on Friday 19 February 2010.
Expect possible resistance at the natural square level of 81.00.
Assuming price does not exceed this level, price pressure will be as follows;
Bullish = AUD/USD, EUR/USD and GBP/USD.
Bearish = USD/JPY, USD/CAD and USD/CHF.
Market Commentary
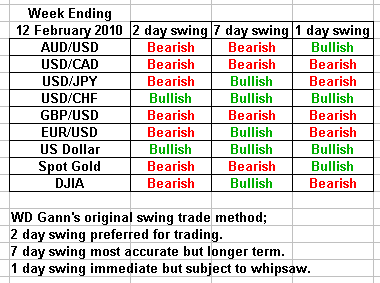
Week beginning 15 February 2010
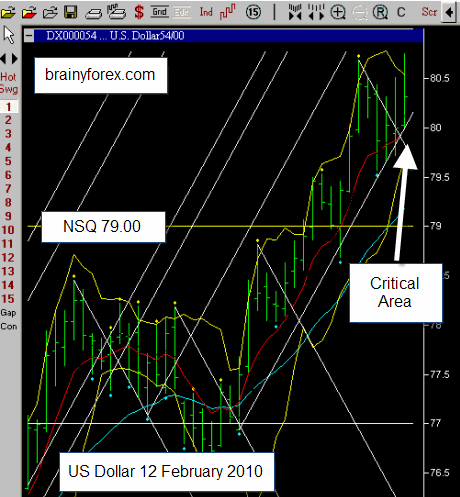
US Dollar daily chart 12 February 2010.
US Dollar closed on 80.31 on Friday 12 February 2010.
The US Dollar may be taking a breather before it's move higher? The next few days should show us what it is going to do. It is currently on a balancing point. Will it fall down a little to 79.00 to test this level as a support level? Or will it continue immediately higher from here?
We will have to watch the early start of the week for answers.
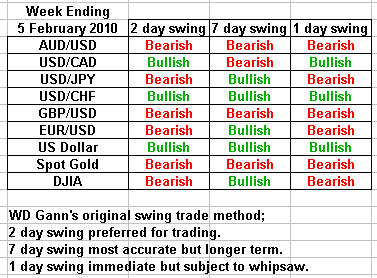
The One day, two day and seven day swing charts shows bullishness.
Assuming upward price action over the next few days for US Dollar, expect the following price pressure of those currencies paired to it to continue as follows;
Bearish = AUD/USD, EUR/USD and GBP/USD.
Bullish = USD/JPY, USD/CAD and USD/CHF.
Market Commentary
Week beginning 8 February 2010
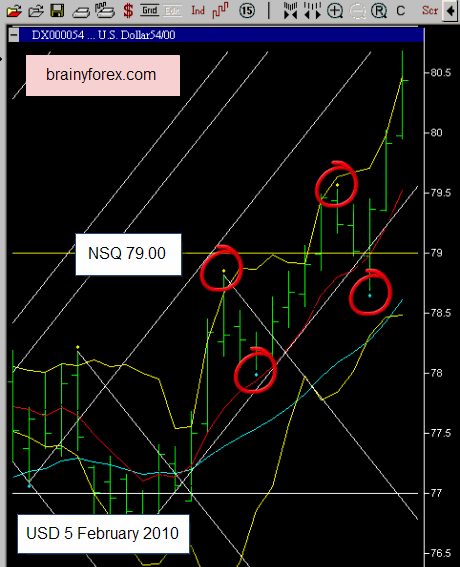
US Dollar daily chart 5 February 2010.
US Dollar closed on 80.44 on Friday 5 February 2010, on its climb higher.
One day, two day and seven day swing charts shows bullishness.
The next natural square level to watch is 81.00. As price has extended considerably, be careful of retracements before price moves higher yet again. There are no signs of reversal of trend at this point.
With this extreme bullish forecast for the US Dollar, expect the following price pressure of those currencies paired to it to continue as follows;
Bearish = AUD/USD, EUR/USD and GBP/USD.
Bullish = USD/JPY, USD/CAD and USD/CHF.
Remember to wait for price retracements against the main trend before entering a position so as to reduce trade risk.
Market Commentary
Week beginning 1 February 2010
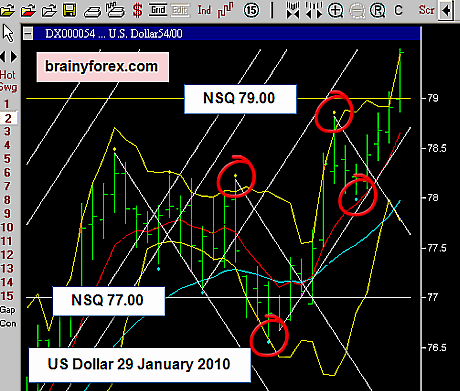
US Dollar daily chart 29 January 2010.
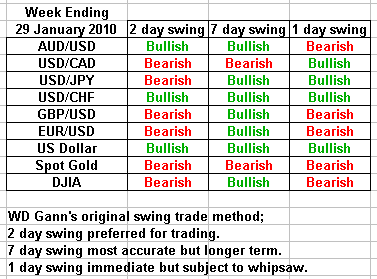
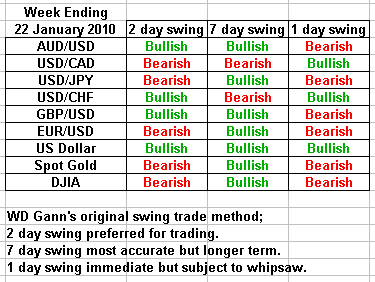
US Dollar closed on 79.46 on Friday 29 January 2010. We see the one day, two day and seven day swing charts showing bullishness.
We also notice price exceeding the 79.00 natural square level, which is another bullish sign.
Where to from here? Assuming there is no sharp reversal of price under 79.00, we should see price stretch higher toward the next resistance level of 81.00 (natural square level).
With this extreme bullish forecast for the US Dollar, expect the following price pressure of those currencies paired to it to continue as follows;
Bearish = AUD/USD, EUR/USD and GBP/USD.
Bullish = USD/JPY, USD/CAD and USD/CHF.
Market Commentary
Week beginning 25 January 2010
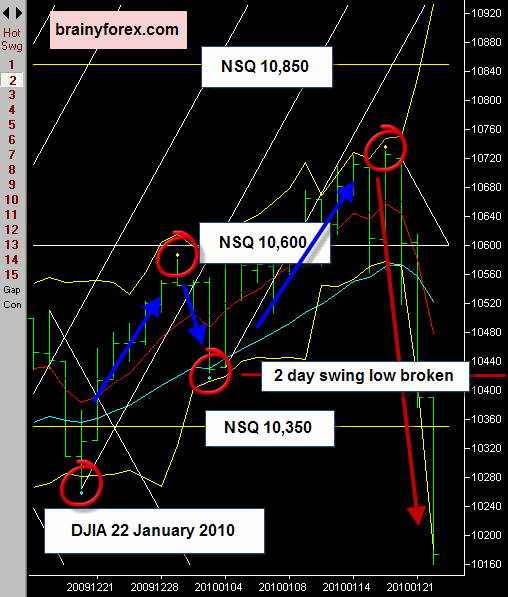
DJIA daily chart 22 January 2010.
Prior week saw our support levels squashed! The DJIA moved down to finish the week at 10,173 points.
Last week we were watching to see if the US stock market could hold the support levels of 10,580 (prior year high) and 10,600 natural square level.
We now see how weak the US Stock Market is! We also notice that the prior month low of 10,236 points was also taken out, showing further weakness.
Notice on the chart that the two day swing low has now been taken out, indicating a downtrend.
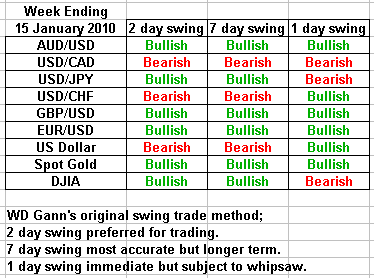
Turning our attention to the US Dollar chart we see the one day, two day and seven day swing chart all indicating bullishness. Expect the US Dollar to continue its upward climb, inverse to DJIA.
We can expect the paired currencies to exhibit the following pressure;
Bearish = AUD/USD, EUR/USD and GBP/USD.
Bullish = USD/JPY, USD/CAD and USD/CHF.
Market Commentary
Week beginning 18 January 2010
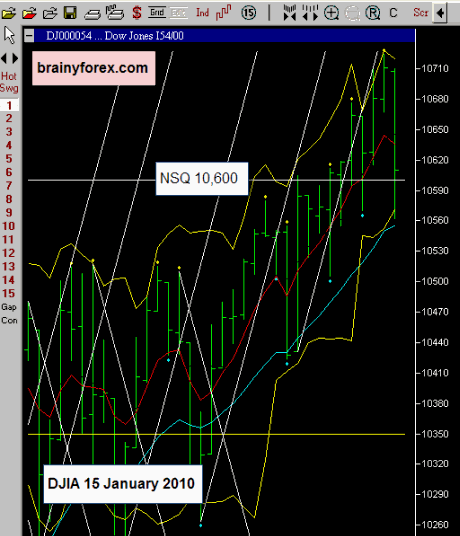
DJIA daily chart 15 January 2010.
Not much change from last week. The market moved upwards the whole week until giving back all its gains on Friday. It closed on 10,610 points. (Down 8 points for the week).
Hence, we still need to watch the support levels of 10,580 (prior year high) and 10,600 natural square level. Will this support level hold? We will have to wait and see.
If support holds and DJIA starts moving upwards again the flow on effect for our major currency pairs should be as follows;
Bullish = AUD/USD, EUR/USD and GBP/USD.
Bearish = USD/JPY, USD/CAD and USD/CHF.
Market Commentary
Week beginning 11 January 2010
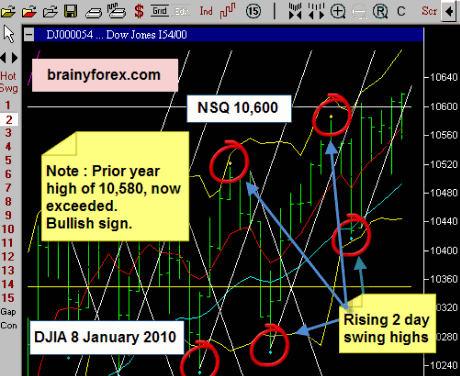
DJIA daily chart 8 January 2009.
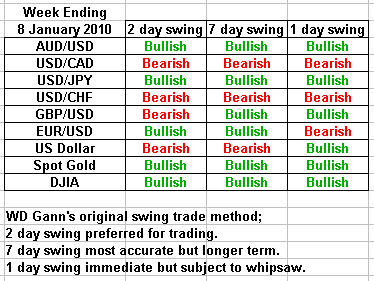
Two major resistance levels have now been exceeded in the US Stock Market. (DJIA) The natural square level of 10,600 and the prior year high of 10,580 points. We also see 1 day, two day and seven day swing charts all showing bullish formations.
With these big bullish signs, expect further advances in the DJIA.
The impact on the US Dollar will be bearish, assuming there is no sudden sharp reversal move in the DJIA from this point. We need to watch the 10,580 and 10,600 levels for support if there is any reversal. If these levels hold then this forecast will remain valid.
The flow on effect for our major currency pairs should be as follows;
Bullish = AUD/USD, EUR/USD and GBP/USD.
Bearish = USD/JPY, USD/CAD and USD/CHF.
Market Commentary
Week beginning 1 January 2010
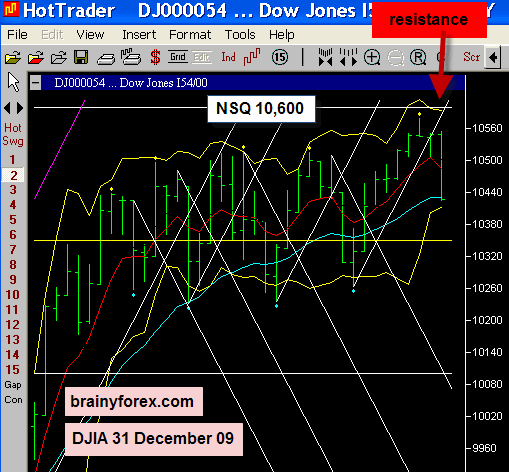
DJIA daily chart 31 December 2009.
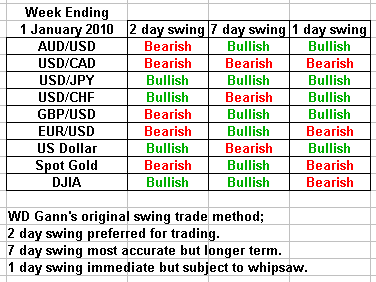
As the US Dollar moves inverse to DJIA, we notice that there is major resistance for DJIA at 10,600 point level. (Refer chart). This means that there is currently pressure on the US Dollar to move steadily upwards until the 10,600 DJIA point level is broken to the upside. (Once this level is broken then it will cause the US Dollar to move downwards).
At this stage, in the short term expect US Dollar to move upwards towards natural square level of 79c. (Followed by 81c). This means pressure right now is as follows;
Bearish = AUD/USD, EUR/USD and GBP/USD.
Bullish = USD/JPY, USD/CAD and USD/CHF.
Market Commentary
Week beginning 21 December 2009
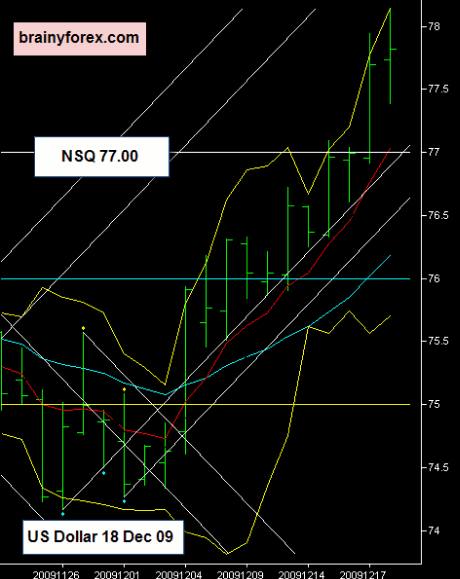
US Dollar daily chart 18 December 2009.
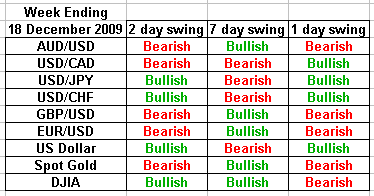
The US Dollar exceeded our natural square target of 77.00 with a fast move to finish the week at 77.82. If there is a price pull back the 77.00 level should act as support before continuing its upward climb towards 79.00.
Over the next few weeks expect the overall trend to be as follows;
Bearish = AUD/USD, EUR/USD and GBP/USD.
Wait for rallies, then enter short.
Bullish = USD/JPY, USD/CAD and USD/CHF.
Wait for pull-backs, then enter long.
Market Commentary
Week beginning 11 December 2009
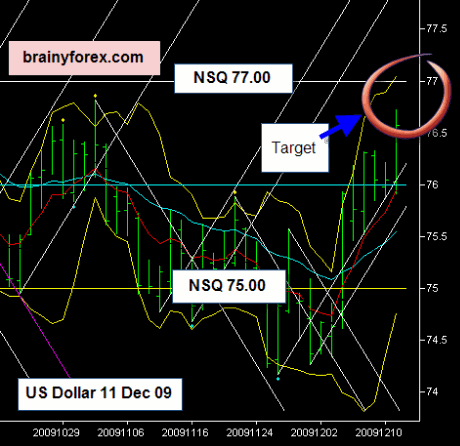
US Dollar daily chart 11 December 2009.
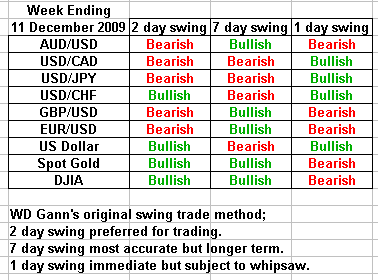
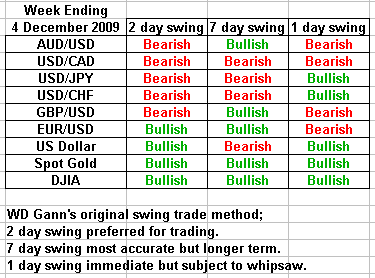
Following from last weeks forecast, we see the US Dollar moving into our target zone of 77.00. Once this natural square level is hit, we have a high probability of a reversal. We cannot say this for a certainty at this stage as the market can easily continue up past this level. The idea is to exercise extreme caution for our major currencies that are paired with the US Dollar as it approaches the 77.00 mark.
We will have to wait for a confirmation pattern or confirmation candle that the 77.00 level will be a valid top (or at least a reaction level) before the US dollar reverses and starts moving back down again.
I would expect price action this week to be as follows;
AUD/USD, EUR/USD and GBP/USD fast temporary move down before reversing upwards again when the US Dollar reaches 77.00 level. (ie Opposite move to the US Dollar)
USD/JPY, USD/CAD and USD/CHF may see pressure for fast temporary move upwards before reversing downwards again as the US Dollar reaches the 77.00 level. (ie In accord with the US Dollar).
Those trading EUR/USD should watch for a bottom at the natural square level of 1.4500 before the possibility of a reversal. Wait for a double bottom on shorter time frames (1 hour or 15 minute charts) before entering a long position.
Market Commentary
Week beginning 7 December 2009
US Dollar daily chart 4 December 2009.
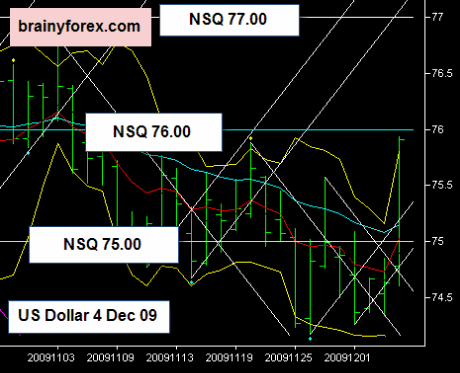
DJIA closed last week on 10,389 points. Natural square support is at 10,350. Gann swing chart still shows uptrend on 2 day, 7 day and 1 day swings. Hence, the favored direction from here is bullish.
For the bullish forecast to remain valid we want to see the index stay above the 10,350 point level.
As seen on the above chart, the US Dollar closed last week on 75.91. It is right on resistance on the natural square level of 76.00. Also, we see on the weekly chart it is against resistance in relation to the vibration level. I would now consider the high possibility of a move back down to test the natural square support level of 75.00.
If the price retracement does not occur on the 76.00 level, this will mean that the 77.00 level will be in play.
As we see above with our inter-market analysis with the DJIA and US Dollar, EUR/USD may prove to be in a good position to trade this week for short term profits. We need to wait for price to show signs of a reversal from it falls near the 1.4800 natural square level. This can be in the form of higher highs and higher lows on the shorter term time frames. (say 1hr or 15 minute). As the 1.4800 is a natural square level and currently in oversold territory it represents a good opportunity for price to retrace back upwards from here. If price cannot hold above the 1.4800 level, it is best to wait and see if price goes lower toward the next natural square level and once again wait for some evidence of a bottom pattern before entering the long position.
Market Commentary Week beginning 30 November 2009
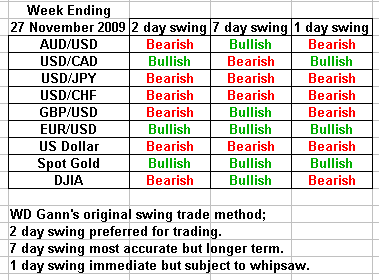
The DJIA now at 10,310 points, has broken down through the uptrend vibration level, fallen below the 50% range level of 10,334 and registered a break to the downside of the two day swing low. This means that the recent uptrend has now weakened considerably.
The US Dollar is currently on the natural square level of 75c. Due to the weakening of the US Stock Market, this will put upward pressure on the US Dollar to appreciate in value.
Due to DJIA weakening, expect downward pressure on AUD/USD, EUR/USD and GBP/USD. And expect upward pressure on USD/JPY, USD/CAD and USD/CHF. Refer the individual swing chart forecasts to see the one day, two day and seven day gann swings for each pair.
US Dollar daily chart 27 November 2009.
Market Commentary Week beginning 23 November 2009
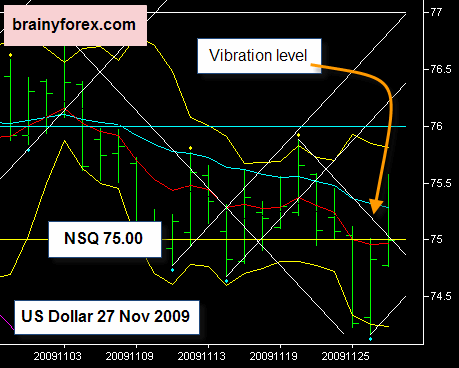
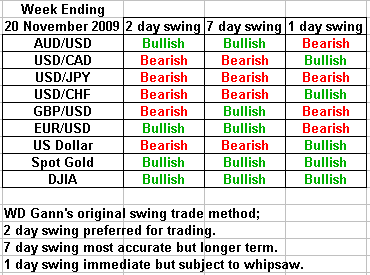
Last week we saw the US Dollar reverse above the 75c natural square level. (17 November, refer chart below). This caused a reversal in the trend for all the major currencies (except USD/JPY) from their established trending direction as shown by the swing chart forecasts.
At the start of this week we will watch to see where the DJIA trades in the next day. Will it fall and find support on the 10,100 level? Or will it shoot above the 10,360 level, thereby continuing its upward climb? Only the next day or two will show us. We can then trade our major currencies accordingly.
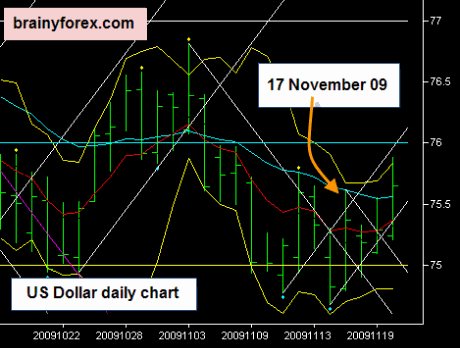
US Dollar daily chart 20 November 2009.
Market Commentary Week beginning 16 November 2009
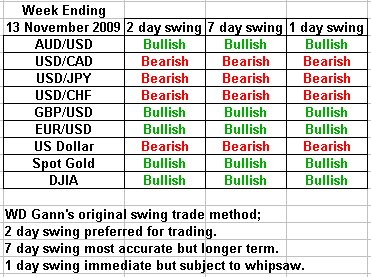
Assuming DJIA (currently 10,270) moves up through the 10,334 point level (50% range resistance) and closes above this level we will see the US Dollar move below the 75c natural square support level, which in turn will set up bullish trades for EUR/USD, GBP/USD and AUD/USD. As well as bearish trades for USD/CAD, USD/CHF, USD/JPY.
Take a look at the Gann swings forecast for the daily, two day and seven day swings. You will notice all time frames are in agreement with each other, thereby showing good trade opportunities in the direction of these swings.
Market Commentary
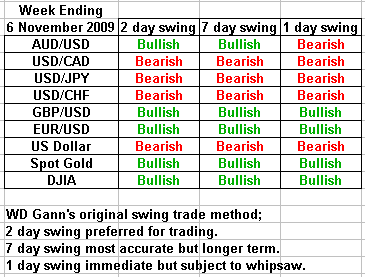
For the week Beginning 9 November 2009
Weekly charts for the Major currencies do not show any signs of large impending moves for this week. They are approaching resistance / support levels.
Also, looking at the bigger picture of inter-market analysis we see the DJIA trying to re-test the natural square resistance level of 10,100 points. The US Dollar is set to test the 75 cent support level.
USD/JPY has now set up for a nice bearish move, with a first profit target of the natural square level of 88.50.
Market Commentary
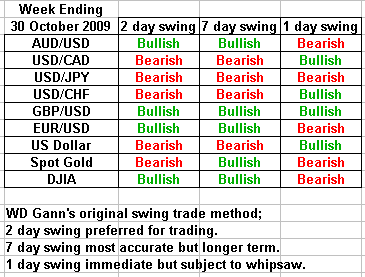
For the week ending 30 October 2009, we see;
DJIA currently in immediate downtrend. Shown by 1 day gann swing = bearish. Vibration level is bearish.
Note that 2 day and 7 day swings are bullish.
US Dollar currently in immediate uptrend. Shown by 1 day gann swing = bullish. Vibration level is bullish.
Note that 2 day and 7 day swings are bearish.
A close eye needs to be kept on the approaching natural square levels for US Dollar and DJIA.
DJIA possible support = 9600 points. US Dollar possible resistance = 77c.
What does this mean for the major currencies paired against the US Dollar?
AUD/USD, EUR/USD & GBP/USD should follow direction of DJIA. That is, move downwards in the short term (next few days) before proceeding with a possible reversal and move back upwards. Our vibration level will alert us when this reversal move is about to happen. We will see how the next few days progress. Watch for the mid-week update in the brainyforex newsletter.
USD/CAD, USD/JPY and USD/CHF are expected to move opposite to AUD, EUR & GBP forecast above.
Be careful with USD/JPY as this pair may just continue to move down from it's current level. All swings 1, 2 & 7 show a downtrend. The vibration level and natural square level also show a full bearish move in progress.
Market Commentary
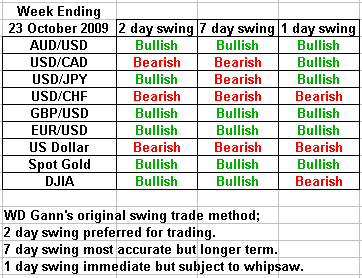
For the week ending 23 October 09, DJIA and US Dollar ended trading without breaking through their natural square resistance levels. (DJIA NSQ = 10,100 and US Dollar NSQ = 75c).
As noted on last weeks commentary, price had a high probability of pausing on these levels.
That means that in the short term we should now see AUD/USD, EUR/USD & GBP/USD make temporary tops and retrace down a little.
For USD/CAD, USD/JPY and USD/CHF these should move upwards in the short term.
Paying attention to the natural square levels for resistance and support means that we will not be caught out trading in the direction of the swing chart forecasts. We have early warning that price may either pause at these levels or make a retracement.
Market Commentary
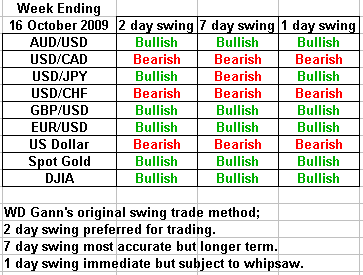
For the week ending 16 October 09, DJIA and US Dollar ended trading near their natural square resistance levels.
This means that there is a 'high probability' that the recent surge in prices for these and the interrelated currencies will pause or retrace for a short time from here.
On Monday or Tuesday I expect to see price for DJIA try and move higher than the 10,100 point level and then be forced down again under this level. For US Dollar, I expect it to try and move lower than the 75c level, but then pushed upwards again.
If the US Stock Market (DJIA) moves easily through the 10,100 level on Monday or Tuesday and remains above this level, then the major currencies will continue their current trend direction.
So the important thing is to watch these critical levels and see if natural square resistance is exceeded.
Note too that on most of the major currencies we currently have completed daily 'Zig Zag' formations on the one day swing charts. This also supports the high probability that the current run in prices is due for a pause or retracement against the current trends.
So be very careful right now in following the above swing chart forecasts. Even though you see them showing full-on bullish or bearish directions - get ready for the retracements.
Return home from swing trading


New! Comments
Have your say about what you just read! Leave me a comment in the box below.