- Home
- Ifc Markets
- Technical Analysis AUDUSD 24 October 2014
Technical Analysis AUDUSD 24 October 2014
by IFC Markets

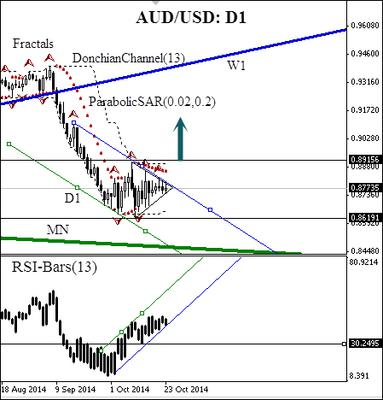
AUD/USD 24 October 2014 Daily Chart
Australian dollar: possible bullish momentum
Today we consider the daily chart of AUD/USD currency pair. At the moment you can observe the price consolidation within the daily downtrend channel. There is no contradiction on the part of RSI-Bars oscillator: its upward movement gives us a reason to suppose a prompt trend reversal to the bullish one. The downtrend reversal is possible but not likely to happen, due to unforeseen fundamental factors, since the monthly downtrend is recorded. In case of a new bearish momentum, you should be aware of the oscillator level breakout at 30.2495%. For conservative traders it is recommended to wait for confirmatory bullish signals from such trend indicators as Parabolic and Donchian Channel, when the price crosses the level of 0.8915. This mark can be used for placing a pending buy order. It is strengthened by the upper boundary of Donchian Channel, Parabolic values and Bill Williams fractal. Stop Loss is better to be placed at 0.8619. This level is reinforced with the fractal and the lower border of Donchian Channel.
After position opening, Trailing Stop is to be moved after the Parabolic values, near the next fractal trough. Updating is enough to be done every day after a new Bill Williams fractal formation (5 candlesticks). Thus, we are changing the probable profit/loss ratio to the breakeven point.
Daily Technical Analysis by IFC Markets
Read previous articles by IFC Markets here
Position Buy
Buy stop above 0.8915
Stop loss below 0.8619
Return to IFC Markets Articles.


