- Home
- Ifc Markets
- Technical Analysis USDCAD 8 October 2014
Technical Analysis USDCAD 8 October 2014

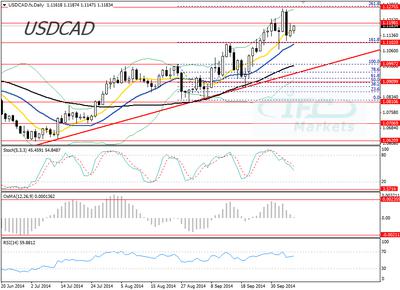
USD/CAD 8 October 2014 Daily Chart
US Dollar Against the Canadian Dollar
Today we are going to look into the US dollar against the Canadian dollar chart pattern. In the last trading sessions upside bias drove prices to a 6-month peak at 1.1275, that level is considered a strong lid because it limited previous attempts to fresh 5-year levels. In addition, the 261.8% Fibonacci level of 1.0997 to 1.0810 is placed at 1.1275 reinforcing its resistance power. In the last two trading sessions we saw an overextended big black candle going below the 10 Simple Moving Average to support at 1.1102 which suggests that the rising bias is vulnerable to bear attacks.
Nevertheless, looking at the price pattern the valid rising trend line and the rest of the 20 and 50 Moving Averages indicate the bullish structure prevails and that suggests in the longer term advancing continuation is the more likely scenario. To build solid bearish expectations we must find some selling indications at the volume and oscillators analysis.
At the above 2nd chart we can see the daily volumes of futures and options traded on the Chicago Mercantile Exchange. It is observable that since September 12th the volume of trading was mostly flat while the prices advanced to resistance 1.1275. Therefore the volume was not going with the trend and is another indication that bears are becoming as strong as bulls. Moreover, the big black candle was not coupled by large volume, thus we consider prices are extending mainly in 1.1275/1.1102 sideways zone.
Looking at the oscillators, the Stochastic has declined lower than the overbought zone following the recent price decline, the Oscillator Moving Average is gradually moving to zero line and the RSI (14) is limited by the upper line at 70. The Bollinger Bands have previously limited the rising bias and we expect them to do the same in a bullish attempt.
In our opinion, chances are slightly favoring the sideways scenario because we see strong resistance at 1.1275 limiting higher levels and at the same time we consider bears are not powerful enough to breach support at 1.1102. Investors can take advantage of the possible range pattern by going long at the bottom and shorting at the top.
Daily Technical Analysis by IFC Markets
Read previous articles by IFC Markets here
Return to IFC Markets Articles.


