- Home
- Ifc Markets
- Technical Analysis XAUUSD 15 October 2014
Technical Analysis XAUUSD 15 October 2014

XAU/USD (GOLD) commodity futures H4 chart
Standard making adjustments
Good afternoon, dear traders. Today Gold Standard Ventures, Nevada gold mining corporation, has released the data on the company’s core project, Railroad-Pinion Gold Project. All the works are done in the area of gold deposits named Carlin, not far from the Emigrant mine. The program of the sample analysis was launched in August 2014, in order to assess the project prospects. Today it has become aware that samples contained high gold content: 0.18 - 2.93 grams per ton of ore. According to the official data released, it would allow the company to increase the production volume and attract new funds to the Pinion project. The outlook for the supply growth in the gold market affected the trading results, which are influenced today by the bearish sentiment.
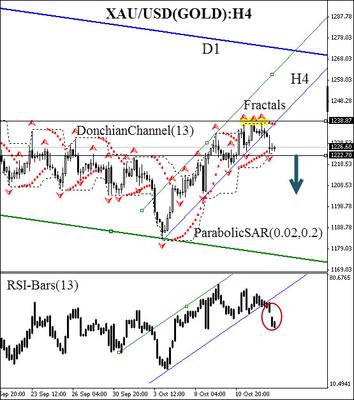
Here we consider the XAU/USD (GOLD) commodity futures on the H4 chart. The upward retracement came to the end when the H4 trend line was broken downwards: this is a significant bearish signal. At the same time there was the RSI-Bars support breach with a gap down. There is no contradiction on the part of the Parabolic trend indicator, which performed a bearish reversal together with the bearish breakdown. We expect the last confirmation of the emerging trend after the price passes the fractal support at 1222.70. This level is strengthened by the Donchian Channel lower boundary, which will immediately be adjusted downwards after the descending movement starts. In our opinion, this mark can be used to place a pending sell order. Note that a rare bearish model is formed now, "triple top" (marked in yellow on the chart). A good level for limiting the risks and placing the initial Stop Loss is 1238.87 dollars per troy ounce.
After position opening, Trailing Stop is to be moved after the Parabolic values, near the next fractal peak. Updating is enough to be done every day after the formation of 5 new H4 candlesticks, needed for the Bill Williams fractal formation. Thus, we are changing the probable profit/loss ratio to the breakeven point.
Position Sell
Sell stop below 1222.70
Stop loss above 1238.87
Daily Technical Analysis by IFC Markets
Read previous articles by here
Return to IFC Markets Articles.


